Vega-Lite & Vega
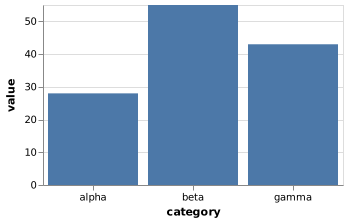
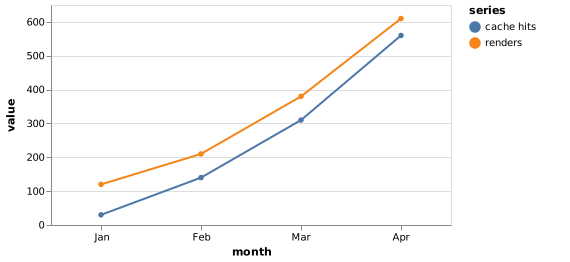
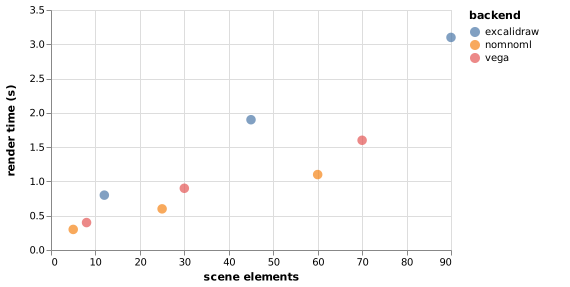
Vega-Lite (Satyanarayan et al. 2017) is a grammar of graphics (Wilkinson 2005) in JSON: you declare what maps to what — fields to positions, colors, shapes — and layout, scales, axes, and legends follow. That declarative economy is why it is arguably the most agent-fluent chart format in existence. Below: a bar chart (Figure 1), a multi-series trend (Figure 2), and a scatter (Figure 3).
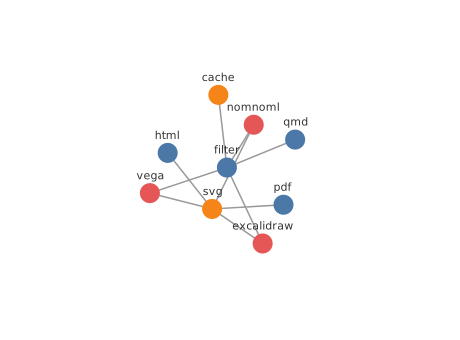
Raw Vega (Satyanarayan et al. 2016) sits one level down and reaches things Vega-Lite cannot — Figure 4 uses its force transform (Fruchterman and Reingold 1991) to lay out a node-edge network with no coordinates in the source at all. Click to zoom.
References
Fruchterman, Thomas M. J., and Edward M. Reingold. 1991. “Graph Drawing by Force-Directed Placement.” Software: Practice and Experience 21 (11): 1129–64.
Satyanarayan, Arvind, Dominik Moritz, Kanit Wongsuphasawat, and Jeffrey Heer. 2017. “Vega-Lite: A Grammar of Interactive Graphics.” IEEE Transactions on Visualization and Computer Graphics 23 (1): 341–50. https://doi.org/10.1109/TVCG.2016.2599030.
Satyanarayan, Arvind, Ryan Russell, Jane Hoffswell, and Jeffrey Heer. 2016. “Reactive Vega: A Streaming Dataflow Architecture for Declarative Interactive Visualization.” IEEE Transactions on Visualization and Computer Graphics 22 (1): 659–68. https://doi.org/10.1109/TVCG.2015.2467091.
Wilkinson, Leland. 2005. The Grammar of Graphics. 2nd ed. Springer.